 PrepEx
· Edited
Hello dear community members!
I want you to write a 2-sentence overview paragraph in the comments section below!
I will provide feedback in the comments. Let's go!
Comments
waseem
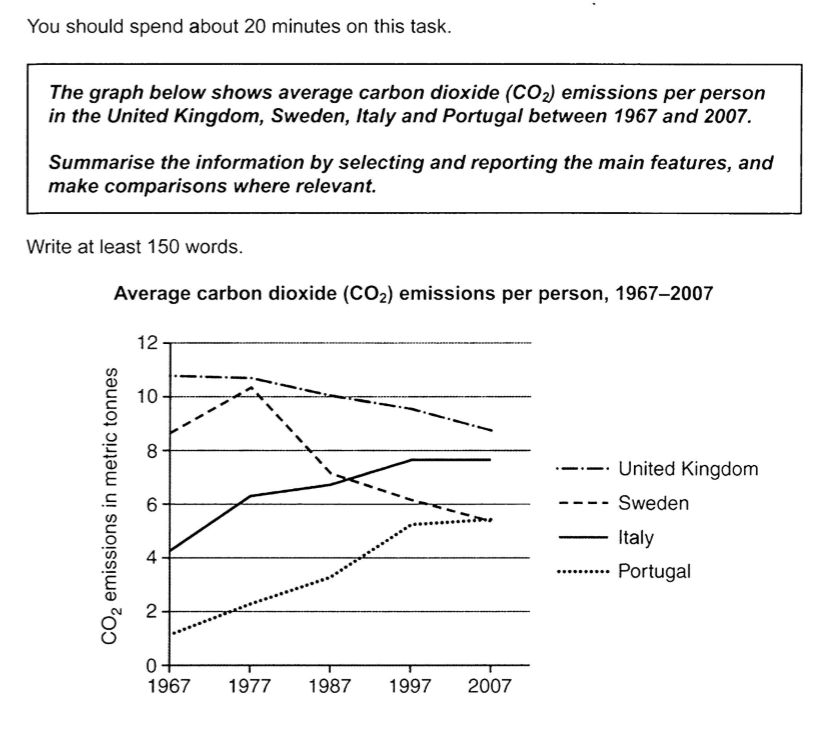
The line graph illustrates changes in average carbon dioxide emissions per person in four European countries—namely the United Kingdom, Sweden, Italy and Portugal—over a forty‑year period from 1967 to 2007.
Overall, the UK and Sweden showed clear downward trends, while Italy and Portugal experienced steady increases. Despite these contrasting patterns, the UK remained the highest emitter throughout, whereas Portugal consistently produced the lowest levels of CO₂.
In 1967, the UK emitted approximately 11 tonnes per person, far exceeding the other countries. Sweden followed at around 9 tonnes, while Italy and Portugal recorded roughly 4 and 1 tonne respectively. Sweden’s emissions rose slightly and peaked at about 10 tonnes in 1977, before declining sharply to around 5 tonnes by 2007. The UK’s emissions fell more gradually, dropping to just under 9 tonnes by the end of the period.
Conversely, Italy’s emissions climbed steadily, reaching nearly 8 tonnes in 2007. Portugal, although starting from a very low base, also saw continuous growth, rising to about 5 tonnes. These trends highlight divergent environmental trajectories, with northern European countries reducing emissions while southern nations increased theirs.
2